Microsoft 365 Copilot ROI Calculator: The Honest Math
Forrester says 353% ROI. Microsoft's own RCT says 0.5 hours per week. The interactive calculator below uses RCT-grounded defaults and shows exactly which lever your business case depends on.

Every Microsoft 365 Copilot ROI calculator on the internet tells the same story. Plug in 1,000 users, accept the default 3-hour weekly time savings, multiply by a generous loaded hourly rate, divide by $30 per seat per month, and out comes a triple-digit ROI percentage. Take it to your CFO. Sign the order. Welcome to the productivity revolution.
That math is wrong. It misses three inputs that decide whether the program actually returns its investment. Most calculators assume 100% adoption when published Microsoft enterprise telemetry shows 35.8% market average. Most accept Microsoft’s self-reported time savings at face value, while Microsoft’s own randomized control trials show users overstate savings by three to seven times. Most ignore implementation services and the Purview governance prerequisites that turn a $360K license bill into a $700K Year 1 commitment.
This calculator is built differently. The defaults come from Microsoft Research randomized control trials, BLS Employment Cost Index data, and current Microsoft 365 Copilot list pricing. Every slider has anchor buttons showing the marketing-optimistic, market-average, and RCT-grounded values. The sensitivity panel makes it impossible to hide the one lever your business case depends on the most.
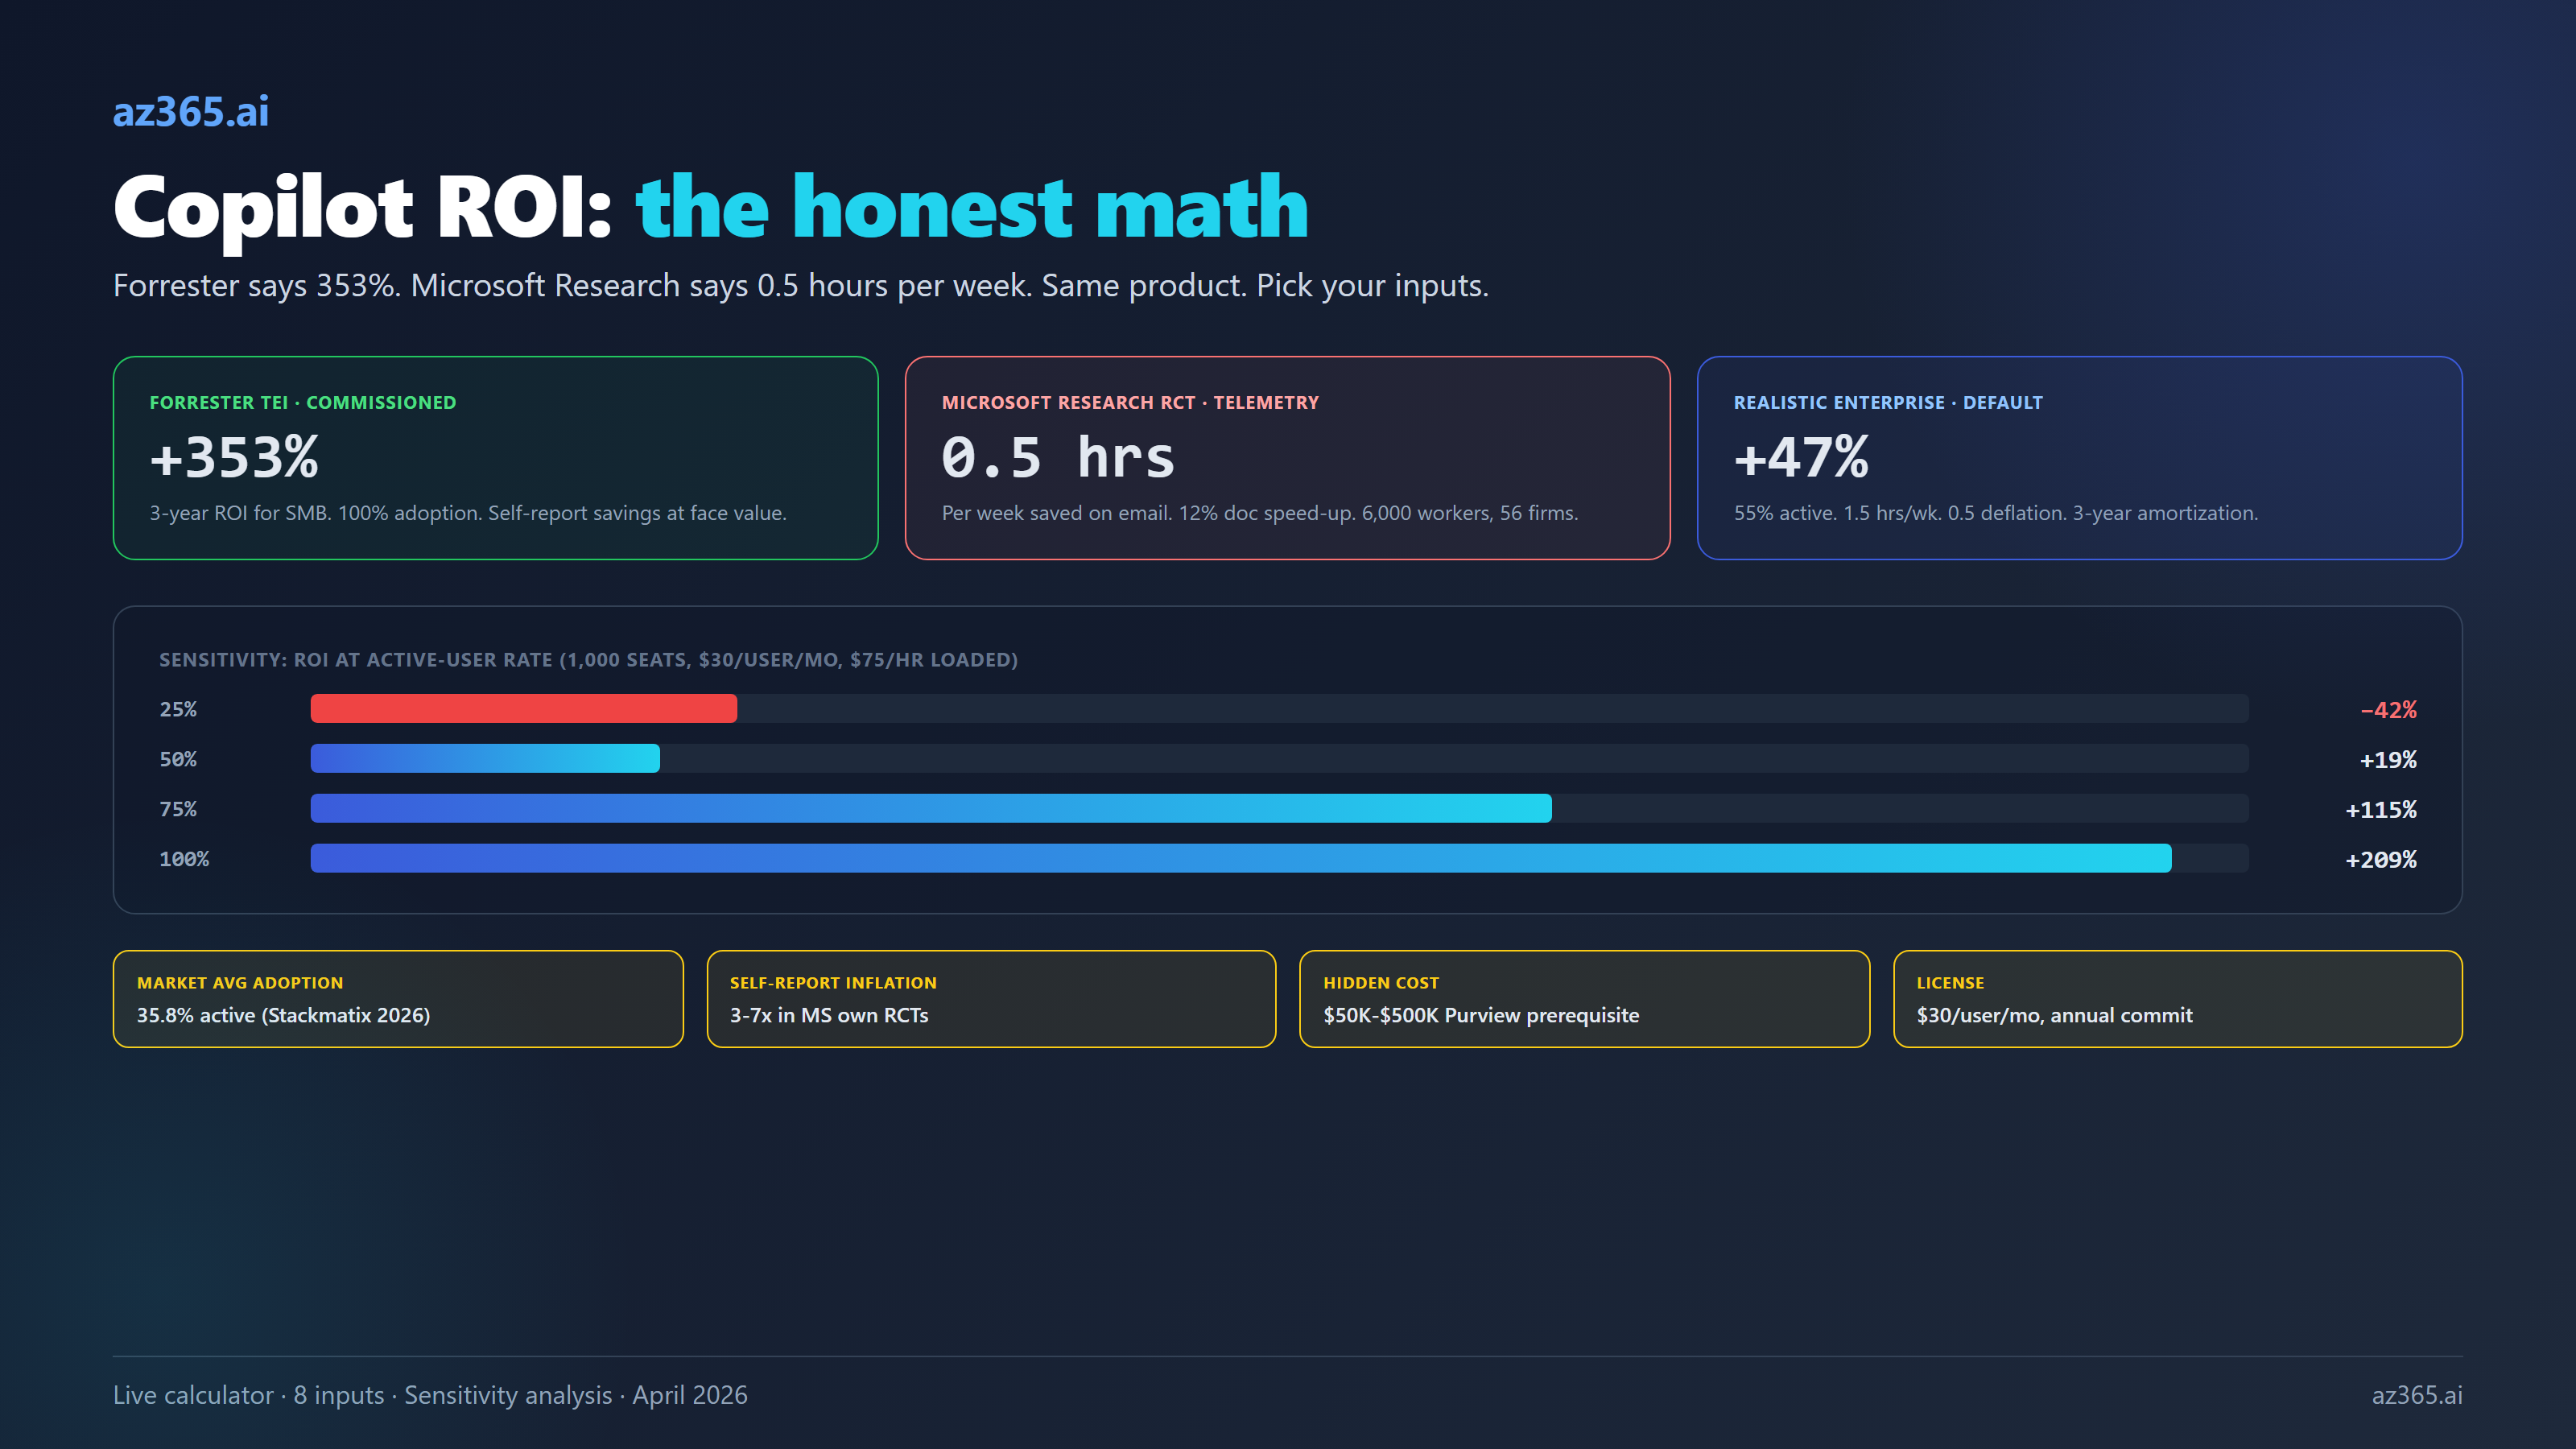
Why Most Copilot ROI Calculators Are Lies
They assume every paid license is active. Microsoft’s official “active user” definition in the M365 admin center is “submitted at least one prompt in the period,” and a single prompt counts. Even by that loose bar, Stackmatix’s 2026 enterprise telemetry shows 35.8% of paid seats are active in any given month. North America runs higher (64% peak), best-in-class deployments hit 75%, but the modal enterprise sits between 35% and 55%. A calculator that defaults to 100% adoption is overstating benefit by 1.5x to 3x before any other input is touched.
They take Microsoft’s self-reported time savings at face value. Microsoft’s Work Trend Index cites “1.2 hours per week” saved from a 297-user early-adopter survey. The Vodafone customer story cites 4 hours per week in legal. Dentsu cites 7.5 hours per week. All self-reported. When Microsoft Research ran an actual randomized control trial across 6,000 workers in 56 firms, the telemetry-measured result was 30 minutes per week saved on email plus a 12% speed-up on document writing. When Microsoft’s Security Copilot RCT compared self-report to control-group completion times, users said they saved 38 minutes; the control group only finished 5 minutes slower. That is a 7x overstatement, in Microsoft’s own data, on Microsoft’s own product.
They forget implementation cost and governance prerequisites. A 1,000-seat enterprise deployment is not just $360K of license. It is $100K to $300K of partner readiness, pilot, and rollout services. It is another five to six figures of Purview labels, DLP rules, and SharePoint oversharing remediation work (the exact number varies dramatically with starting tenant maturity), because Copilot grounds on whatever the user has access to and most enterprises discover they have a permissions mess before they have a Copilot deployment. It is often pressure to upgrade from M365 E3 to E5 (or to add Purview / Defender SKUs) to meet Copilot’s compliance baseline. None of these costs sit on the Copilot invoice.
The calculator below builds those three corrections in by default. You can move every slider to the Microsoft-marketing optimistic value if you want. The point is that the defaults are not pulled from a vendor deck.
The Calculator
Free Tool
Microsoft 365 Copilot ROI Calculator
Defaults are RCT-grounded, not vendor-marketing. Adjust the sliders for your scenario. Results update live.
Want a defensible ROI memo for procurement?
Send your scenario and I will return a 2-page Copilot ROI memo with the math, the citations, and the lever-by-lever sensitivity analysis your CFO will sign off on. No sales pitch.
How to Read the Result
Start with the worked example. The calculator opens with these defaults: 1,000 seats, $30/user/month list price, 55% active rate (the upper end of the 35-55% modal-enterprise range per Stackmatix), 1.0 hour saved per active user per week, 0.5 deflation factor (because Microsoft’s Security Copilot RCT showed users overstate savings ~7x). The 1.0 × 0.5 deflation lands the effective benefit at 0.5 hours per week, matching the RCT-measured value the article cites. Plus $75/hour fully-loaded knowledge-worker cost (BLS ECEC December 2025), 40 productive weeks per year, and $175,000 one-time implementation amortized over three years.
The math: 1,000 × 0.55 × 1.0 × 40 × 0.5 = 11,000 hours saved per year. At $75 per hour that is $825,000 annual benefit. Annual cost is $360,000 license plus $58,333 amortized implementation = $418,333. Net annual value: +$406,667. ROI: +97%. Payback period: 4.5 months. Break-even active rate (the rate at which benefit equals cost, holding all else constant): 27.9%.
That number lives below Forrester’s 116% three-year case, consistent with the article’s claim that the realistic ROI sits below vendor-marketing benchmarks. Move the active-rate slider down to 35% (Stackmatix’s global market average) and ROI drops to roughly +25%; below the 27.9% break-even rate, the program runs at a loss.
Three numbers in that output do real work.
The headline ROI percentage is annual benefit divided by annual cost expressed as a percentage. ROI of 0% means the program pays for itself but produces no surplus. The Forrester TEI commissioned for Microsoft puts enterprise Copilot at 116% over three years; that model uses Microsoft self-reported time savings without deflation and assumes high adoption. Move the deflation factor slider to 1.0 and the active rate slider to 75% to see the Forrester-style number. Move them the other way (35% active, 0.3 deflation) and the realistic case turns negative.
The break-even active rate is the percentage of licensed users who must be active for the program to pay for itself at the rest of your inputs. This is the most useful number on the page. If your scenario shows a break-even of 65%, and your enterprise is honestly going to land at 45% adoption, the program does not return its investment until you fix adoption. That is a different conversation than “is Copilot worth $30 per user per month.”
The sensitivity chart on the right shows ROI at 25%, 50%, 75%, and 100% active rates, holding everything else constant. If the 25% bar is deeply negative and the 100% bar is strongly positive, your Copilot business case is an adoption problem dressed as a procurement question. The right move is to invest in adoption enablement before you scale the seat count, not after.
The Levers That Actually Move the Answer
In order of impact for typical enterprise inputs.
Active-user rate. Going from 35% (market average) to 75% (best-in-class) doubles the benefit at constant inputs. This is the single biggest lever and it is the one finance leaders ignore because it does not feel like their lever. It is. License procurement and adoption enablement cannot be split between two budgets without losing the program in the gap.
Hours saved per active user per week. Microsoft self-report sits at 1.2 to 3 hours. Telemetry-measured RCT sits at 0.5 hours. Use 1.5 hours as a midpoint with a 0.5 deflation factor and you land at the same effective benefit (0.75 hours per week). Choosing the optimistic number without deflation is the same mistake as choosing 100% adoption.
Hourly loaded cost. BLS Employment Cost Index for December 2025 shows civilian total compensation at $48.78 per hour. Knowledge worker personas typically run $50 to $150 per hour fully loaded. Use a weighted average of your role mix; do not default to “VP of Sales” rates if 80% of your Copilot users are individual contributors.
Implementation and governance cost. EPC Group benchmarks for 1,000-seat deployments: $15K readiness assessment, $25-50K pilot, $75-250K full deployment, $50-500K Purview prerequisite work depending on starting maturity. The governance work is the most underestimated line item because most procurement teams treat it as a sunk Microsoft 365 cost rather than a Copilot-driven cost. It is a Copilot-driven cost because nobody was going to remediate SharePoint oversharing without the Copilot business case forcing it.
License price. Mostly fixed at $30 per user per month annual commit. The adjustable case is role-based copilots (Sales, Service, Finance), which run $50 standalone or $20 incremental for licensed M365 Copilot users. If your scenario is M365 Copilot only, leave this slider alone.
What This Calculator Does Not Measure
A defensible ROI memo discloses what is not in the model. This calculator does not include:
- Switching costs. Time lost reformatting prompts, fixing hallucinations, re-checking Copilot output against ground truth before pasting it into a customer email.
- Training and onboarding time. Four to twenty hours per user lost to enablement workshops, prompt courses, and change management. Real cost on a real calendar.
- Cognitive overhead. The “second monitor problem”: context-switching between Copilot, the source document, and the validation step often eats the savings the tool produces. RCTs do not measure this directly; field experience says it is real for non-trivial work.
- Integration debt. SharePoint permissions remediation, Purview labeling backfill, retention policy gaps. These are Copilot-driven costs that do not appear on a Copilot invoice.
- License waste on inactive users. ~64% of paid seats are inactive in a given month at average. The active-rate slider models the ones who use it; the seats that do not are a pure cost line.
- Output-quality regressions. Documents drafted by Copilot are written 12% faster but the experiment did not measure quality acceptance rate downstream. Some outputs go through more revision cycles, eating the speed gain.
The point is not to skip Copilot but to defend the business case with eyes open. Procurement teams that are surprised by item 4 in month nine often kill a working program for the wrong reason.
How to Use This With Your CFO
Present three scenarios, not one. Conservative (35% active, 0.5 hours per week, 0.3 deflation), realistic (55% active, 1.5 hours per week, 0.5 deflation), optimistic (75% active, 3 hours per week, 1.0 deflation). Show all three. Recommend the realistic. CFOs trust ranges with a recommendation; they distrust point estimates with marketing copy.
Include the break-even active rate prominently. “We need 47% of licensed users active each month for the program to pay back. Current adoption in the pilot is 38%. The first $200K of incremental investment should go to adoption enablement, not seat expansion.” That sentence reframes the conversation from “should we buy Copilot” to “what does it take to make the seats we are about to buy actually work.”
Separate license cost from program cost. Procurement will see the $30 per user per month and approve it. Do not let the $200K of partner services and the $300K of Purview governance work hide in operating budgets. Itemize them in the same memo. Cap the program before it caps you.
The calculator above does not solve the procurement decision. It gives you the math to defend whatever decision you make. Move the sliders, save the scenario, send the memo. The honest version is more persuasive than the optimistic one because the honest version is the one that survives quarterly review.
Related Reading
- Azure OpenAI PTU vs PAYG: The Real Break-Even Table - the same honesty principle applied to Azure AI consumption pricing
- Claude on Azure: The Marketplace Billing Trap - the procurement gotcha that most AI cost calculators miss
- AI Copilots vs Custom AI on Azure: Build vs Buy - the build-vs-buy decision that comes before the ROI calculation
- AI Readiness Assessment for Microsoft Enterprises - the 8-dimension assessment that flags adoption risk before the procurement decision
The calculator above uses the same input structure as a real ROI memo. Run it with your own labor costs, license counts, and adoption rates before quoting any number to procurement.
Stay in the loop
Get new posts delivered to your inbox. No spam, unsubscribe anytime.
Related articles
AI Copilots vs Custom AI on Azure: When to Build and When to Buy
Real cost math comparing Microsoft Copilot at $30/user/month to Azure OpenAI at pennies per query. Decision framework for architects choosing build vs buy.
Copilot Credits Went Live: What Work IQ and Cowork Actually Cost
Copilot Credits billing went live June 16 across Work IQ and Cowork: the real per-call cost, the license gate, and the controls to set before July 1.
Claude on Azure: The Marketplace Billing Trap
Why Microsoft for Startups credits do not cover Claude on Azure Foundry, where Claude Opus 4.7 actually deploys, and the pre-flight checks architects must run before shipping.